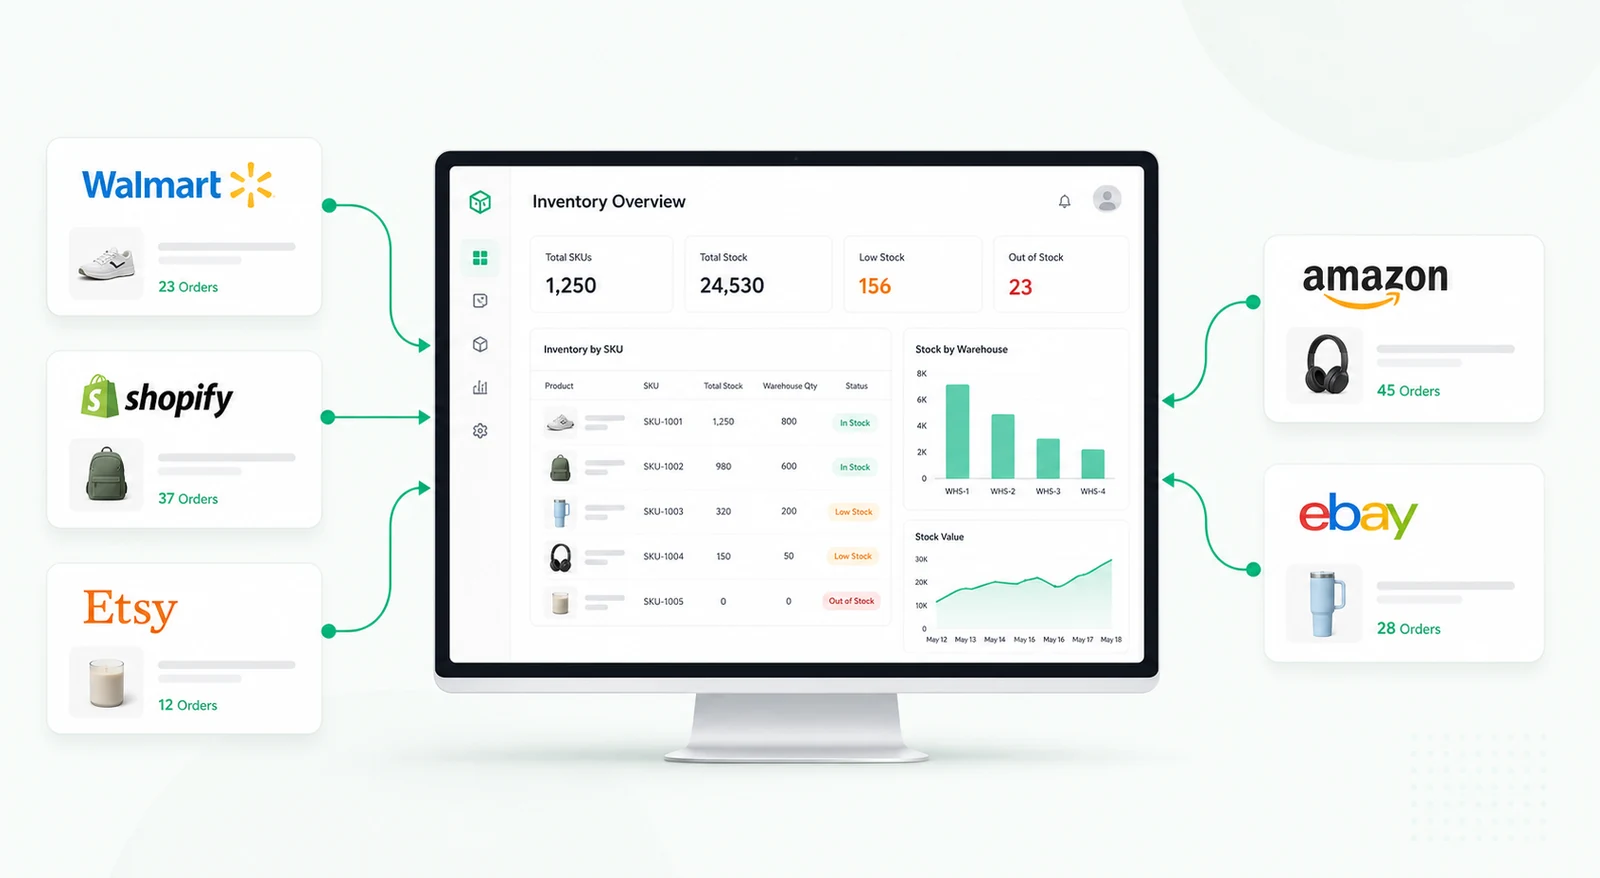
A dashboard for retail and operations teams to monitor inventory losses, identify shrinkage patterns, and prevent high-risk product theft or damage.


Inventory shrinkage is the difference between recorded stock and the stock physically available. It can result from theft, damage, receiving errors, incorrect adjustments, process failures, or inaccurate product data. Because these losses are often spread across POS systems, warehouse records, cycle counts, and incident reports, teams may see the financial impact without understanding where it started.
An inventory shrinkage and loss prevention dashboard brings these signals together. Retail, warehouse, finance, and loss-prevention teams can monitor shrinkage by location, product, category, time period, and incident type from one shared operational view.
The dashboard compares expected inventory with actual inventory and records the quantity and value of the variance. Expected stock can be calculated from opening inventory, receipts, sales, returns, transfers, and approved adjustments. Physical counts or trusted stock records provide the actual quantity used for comparison.
Users can view total shrinkage value, shrinkage percentage, units lost, and changes over time. Filters can narrow results by store, warehouse, product category, supplier, brand, region, or date range.
Not all shrinkage has the same cause or financial impact. The dashboard can rank products and locations by loss value, loss frequency, or percentage variance. This helps teams distinguish a small number of expensive losses from repeated low-value discrepancies.
Heatmaps and trend charts can show where shrinkage clusters by day, shift, department, or transaction type. Comparing locations can reveal whether a problem is isolated to one store or represents a wider process issue.
Store managers and operations teams can log incidents directly from the dashboard. Each record can include the location, product, quantity, suspected cause, supporting notes, attachments, and assigned investigator.
Incidents can move through stages such as reported, under review, action required, resolved, or closed. Comments and evidence remain attached to the incident, creating a clear history of the investigation and any corrective actions.
Automated alerts can notify teams when shrinkage exceeds a threshold, a high-risk product shows repeated losses, a store's rate rises sharply, or an incident remains unresolved. Notifications can be routed to store leadership, loss prevention, finance, or regional operations based on severity and ownership.
The dashboard can also track preventive actions such as retraining, process changes, supplier claims, security reviews, stock recounts, or revised approval controls. Linking actions to the original loss pattern helps the business assess whether the intervention worked.
Retool can connect to POS systems, warehouse databases, inventory platforms, spreadsheets, and incident-management tools. Queries can join transaction, stock, receiving, and adjustment data to calculate variance and financial impact.
Metric cards, tables, charts, heatmaps, and detail modals can support both executive reporting and daily investigation. Role-based access can separate store-level information from regional or company-wide reporting.
Inventory shrinkage is the difference between the stock a business expects to have and the stock it actually has after sales, receipts, returns, transfers, and adjustments are considered.
Common causes include theft, damage, receiving mistakes, incorrect data entry, unauthorized adjustments, supplier discrepancies, and process failures.
Yes. Retool can connect to databases and APIs from POS, ERP, warehouse, ecommerce, and inventory-management systems.
Yes. Thresholds can be set by store, warehouse, category, SKU, financial value, or shrinkage percentage.
Yes. Forms and modals can capture incident details, evidence, ownership, status, comments, and corrective actions.
Yes. Variances can be converted into cost or retail value using product and accounting data, allowing teams to monitor the financial effect over time.
For related ecommerce workflows, explore the multi-channel product dashboard, or request a custom Retool build.
We're officially approved by Retool and proud to be an agency partner!

Visit our blog to learn more about our innovative approaches to solving complex challenges.