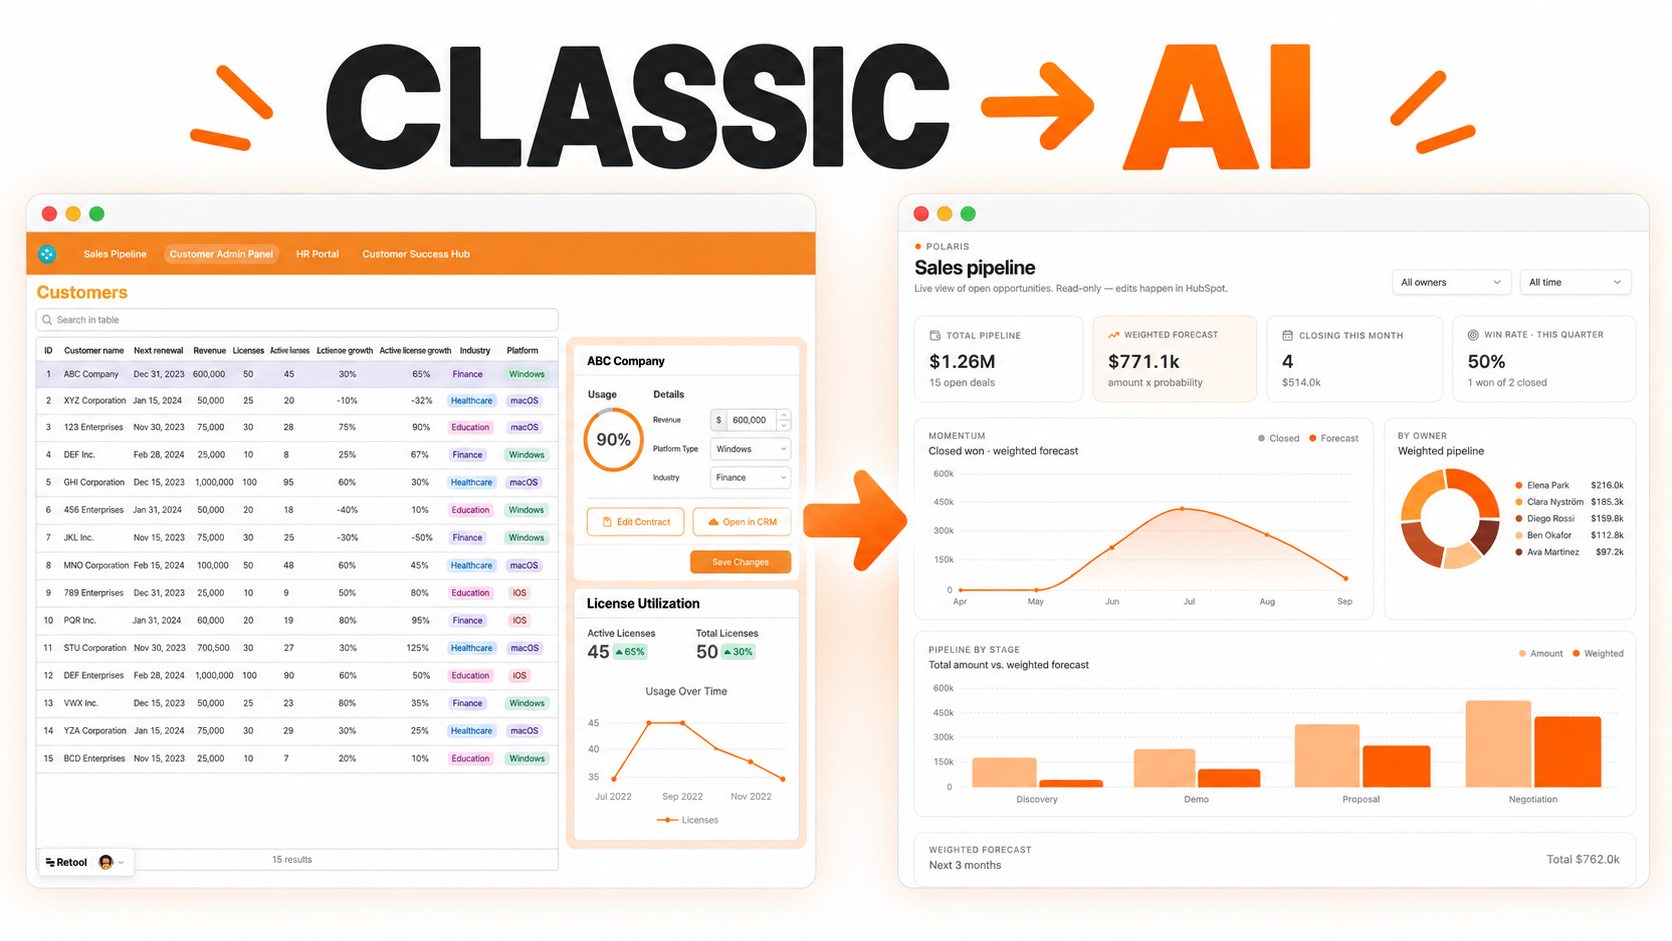
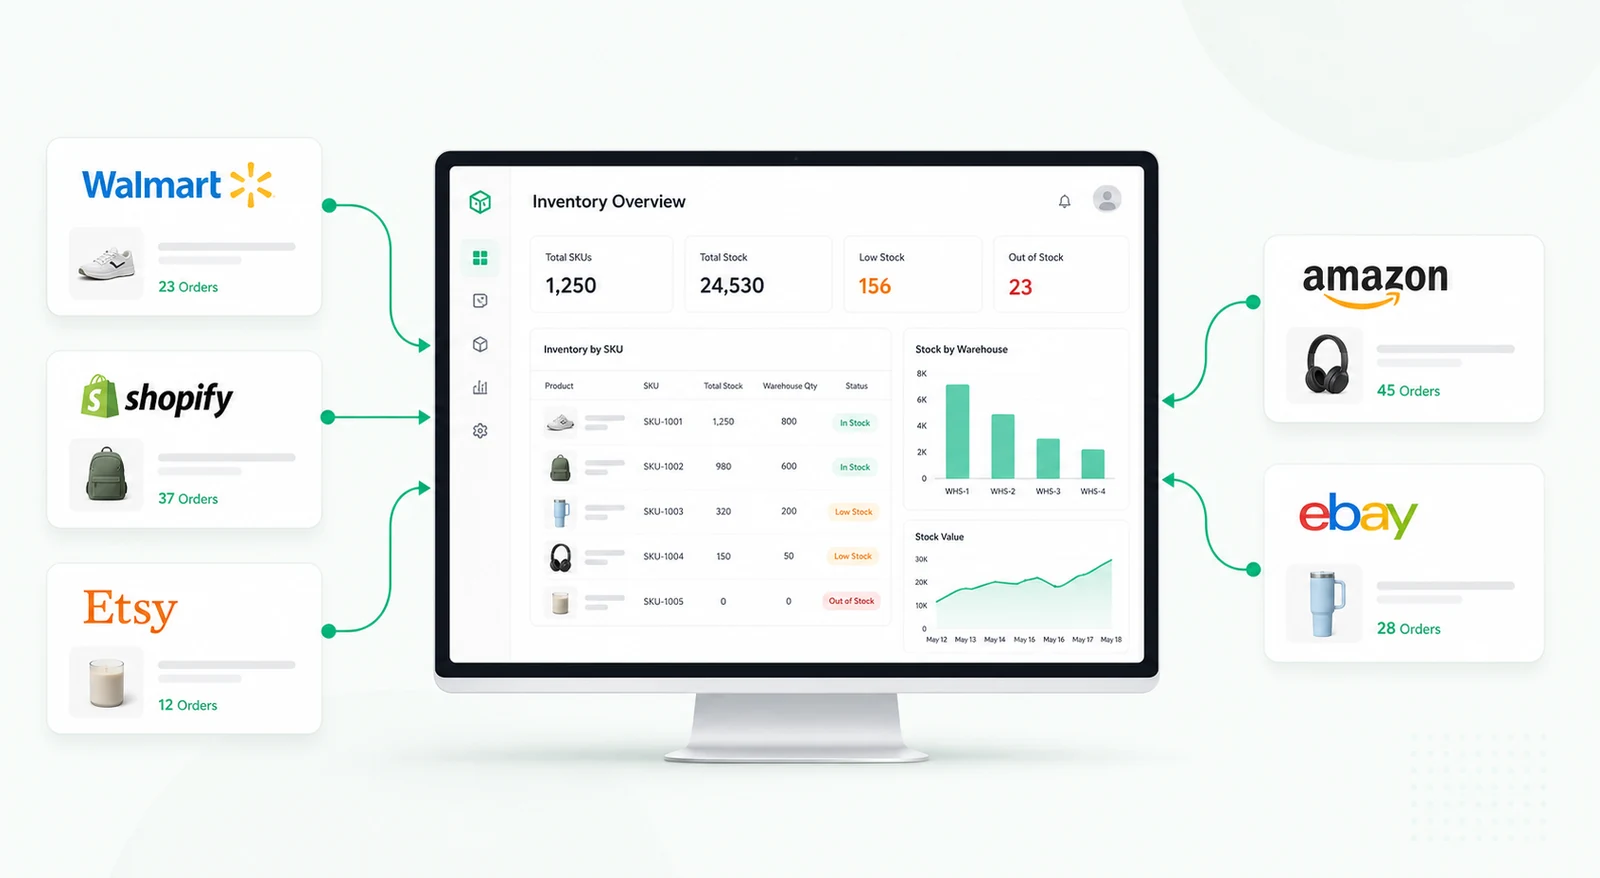
A management dashboard for monitoring revenue, cost of goods, gross margin, expenses, net profit, targets, and performance trends.


Monthly profit and loss reporting is often assembled after the period has ended, leaving operators without a clear view of current performance. A live P&L dashboard brings revenue, direct costs, gross profit, operating expenses, and net profit into one management view.
Metric cards and progress indicators compare actual results with targets. Managers can quickly see whether margins, cost percentages, and profit are moving in the expected direction.
Revenue trends show performance across recent months, while category charts explain where cost of goods and operating expenses are concentrated. Drill-down views can expose supplier or account-level detail when further investigation is required.
Retool can query accounting databases, spreadsheets, and finance APIs, apply business calculations, and present the results through cards, tables, and charts. Filters allow teams to change periods, departments, entities, or locations without rebuilding reports.
We're officially approved by Retool and proud to be an agency partner!

Visit our blog to learn more about our innovative approaches to solving complex challenges.