Duy Vu
August 7, 2024
•
15 min read

Building a dashboard doesn’t have to be complicated. Whether you're a seasoned developer or just dipping your toes into the world of data visualization, creating a sleek, functional dashboard can be both easy and rewarding. In this guide, we'll walk you through the process of building a dashboard from scratch, using a modern, minimal approach that keeps things simple and effective.
Before you start building, it’s crucial to understand what your dashboard will do. Ask yourself:
Understanding the purpose will guide your decisions on what to include and how to present it. Remember, a well-defined dashboard is half the battle won.

Your dashboard is only as good as the data that fuels it. Identify the data sources you'll need, whether it’s a database, an API, or a spreadsheet. Tools like Retool make it easy to connect to a wide variety of data sources with minimal setup. The key here is to ensure your data is accurate, up-to-date, and relevant to the dashboard’s purpose.

https://www.retoolers.io/integrations
The layout of your dashboard should be intuitive and user-friendly. Start by sketching out a rough design—this can be as simple as drawing boxes on a piece of paper. Consider:
Retool provides pre-built components like tables, charts, and forms that you can drag and drop to quickly assemble your dashboard’s layout. A clean, minimal design helps users focus on the data that matters.

Choosing the right visualization for your data is crucial. Bar charts, line graphs, pie charts, and tables all have their place, depending on the data you're displaying. Retool’s component library offers a variety of visualization options that are easy to configure and customize.
When selecting visualizations, think about:

With your layout planned and visualizations selected, it’s time to connect your data. In Retool, this is as simple as binding data sources to components. You can use SQL queries, JavaScript, or even the visual query builder to fetch and manipulate your data. As you connect your data, ensure it flows logically and refreshes in real time, keeping your dashboard up-to-date.

Find out how to connect Retool to Google Cloud Storage
https://www.retoolers.io/blog-posts/connecting-retool-to-google-cloud-storage-a-step-by-step-guide
A great dashboard doesn’t just display data—it lets users interact with it. This could mean filtering data, drilling down into specifics, or updating records directly from the dashboard. Retool makes adding interactivity straightforward with features like dropdowns, input forms, and buttons, all of which can trigger actions like API calls or database updates.
Interactivity enhances the user experience and makes your dashboard a powerful tool for decision-making.

Before you launch your dashboard, test it thoroughly. Check for data accuracy, usability, and performance. Gather feedback from real users and be prepared to iterate. The best dashboards are those that evolve over time, adapting to the changing needs of their users.
Retool’s live preview and easy editing make it simple to tweak and refine your dashboard until it’s perfect.

Building a dashboard from scratch can be an exciting journey, but it can also be a challenge if you're new to the process. By following these seven steps, you're well on your way to creating a dashboard that truly delivers value. However, if you’d rather focus on what you do best and leave the dashboard creation to the experts, why not reach out to the team at Retoolers? We specialize in building custom dashboards that are tailored to your specific needs, so you can focus on making data-driven decisions without worrying about the technical details.
Ready to bring your dashboard vision to life? Contact Retoolers today, and let us help you create a powerful, intuitive dashboard that meets your exact requirements.
Looking to supercharge your operations? We’re masters in Retool and experts at building internal tools, dashboards, admin panels, and portals that scale with your business. Let’s turn your ideas into powerful tools that drive real impact.
Curious how we’ve done it for others? Explore our Use Cases to see real-world examples, or check out Our Work to discover how we’ve helped teams like yours streamline operations and unlock growth.

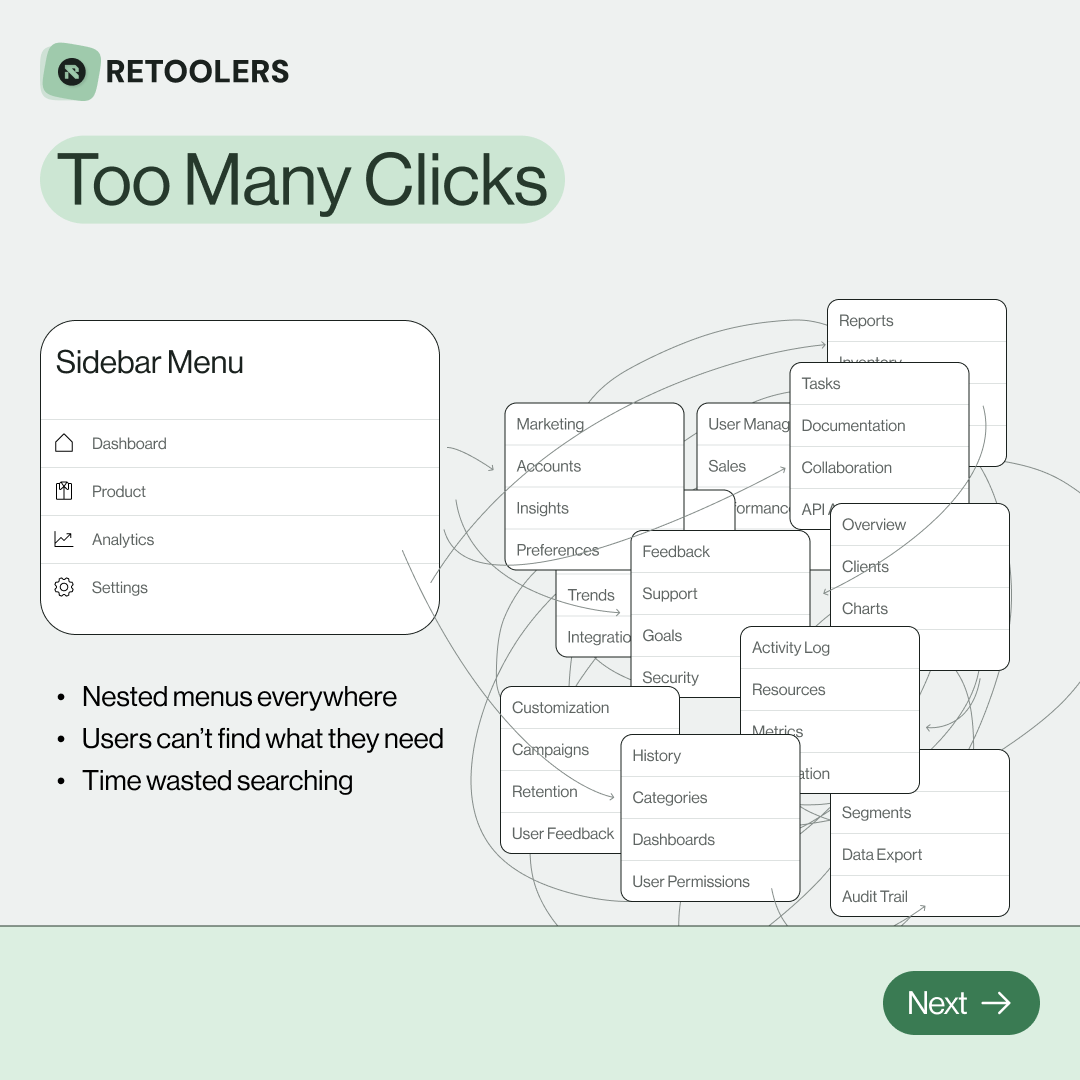
🔎 Internal tools often fail because of one simple thing: Navigation.
Too many clicks, buried menus, lost users.
We broke it down in this 4-slide carousel:
1️⃣ The problem (too many clicks)
2️⃣ The fix (clear navigation structure)
3️⃣ The Retool advantage (drag-and-drop layouts)
4️⃣ The impact (happier teams)
💡 With Retool, you can design internal tools that are easy to use, fast to build, and simple to maintain.
👉 Swipe through the carousel and see how better UX = better productivity.
📞 Ready to streamline your tools? Book a call with us at Retoolers.

🚀From idea → app in minutesBuilding internal tools used to take weeks.
Now, with AI App Generation in Retool, you can describe what you want in plain English and let AI do the heavy lifting.
At Retoolers, we help teams move faster by combining AI + Retool to create tools that actually fit their workflows.
👉 Check out our blog for the full breakdown: https://lnkd.in/gMAiqy9F
As part of our process, you’ll receive a FREE business analysis to assess your needs, followed by a FREE wireframe to visualize the solution. After that, we’ll provide you with the most accurate pricing and the best solution tailored to your business. Stay tuned—we’ll be in touch shortly!


